

Conveyancing and Notary examinations – all nine provinces – analysis of the published results lists (prepared 9 October 2026)
| Conveyancing candidates | Paper 1 pass rate | Paper 2 pass rate | Notary pass rate |
| 1034 | 4.8% | 5.4% | 11.9% |
| 27 cleared every paper written | 45 of 931; 81 to orals | 46 of 854; 97 to orals | 74 of 622; 111 to orals |
Key findings
- Outright pass rates were very low. Only 4.8% of Conveyancing Paper 1 scripts and 5.4% of Paper 2 scripts scored 50% or more. Average marks were 23.7% (Paper 1) and 24.8% (Paper 2).
- Very few candidates finished. Of 1034 conveyancing candidates, 27 (2.6%) cleared every paper they wrote. A further 80 remain in contention through orals and 31 banked a credit for one paper; 896 failed outright.
- Notary performed better but is still weak. 11.9% passed and 29.7% reached 40%+ (pass or oral), with an average of 31.3%.
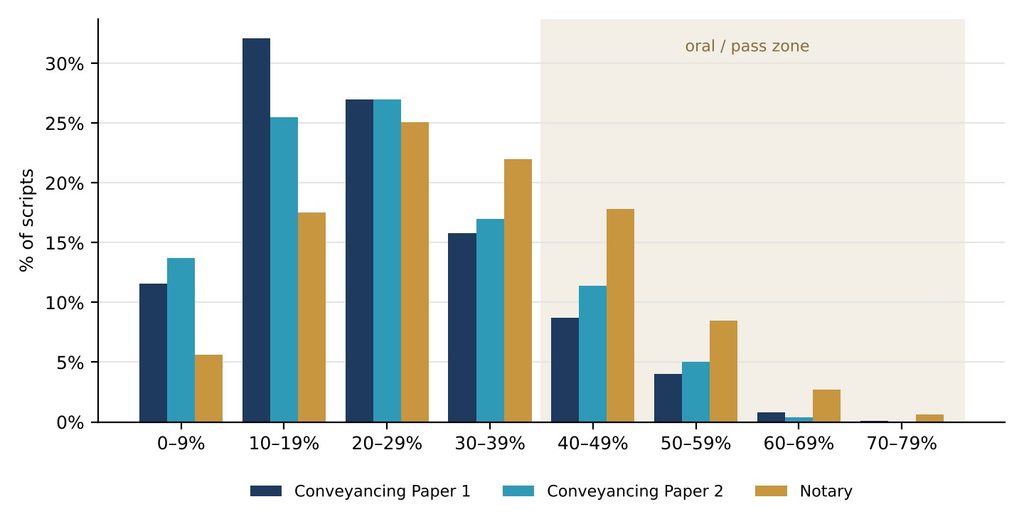
- This is a preparation gap, not a near-miss problem. About 71% of Paper 1 scripts and 66% of Paper 2 scripts scored below 30%. Only 42 conveyancing scripts landed in the 45-49% range.
- 283 candidates wrote only one conveyancing paper, most likely rewriting with a credit from an earlier sitting.
Provincial highlights
- KwaZulu-Natal was strongest on Paper 1: 12.0% passed and 28.6% reached 40%+.
- Western Cape led the Notary exam: 23.5% passed, 45.9% reached 40%+, and it had the highest single mark (77%).
- Gauteng supplied 42% of all conveyancing candidates (438) but had a Paper 1 pass rate of only 2.2%.
- Free State, Mpumalanga and Northern Cape recorded no Paper 1 passes. North West and Northern Cape recorded no Notary passes (Northern Cape had no script at 40%+ in any exam).
- Mpumalanga is the outlier on Paper 2: 32.1% reached 40%+, the best in the country, despite no Paper 1 candidate reaching 40%.
Method and notes
- Source: the LPC’s published Conveyancing and Notary results lists for all nine provinces, identified by membership number only.
- Thresholds follow the LPC notes on the lists: 50%+ passes a paper, 40-49% qualifies for an oral, below 40% fails.
- Where a candidate wrote only one conveyancing paper, the mark is counted for that paper only. Single marks were assigned to Paper 1 or Paper 2 by their column on the results sheet.
- Oral outcomes are not yet known, so final pass rates will be somewhat higher than the written pass rates shown here.
- 140 membership numbers appear on both the conveyancing and notary lists.
Share of scripts reaching 40% or more, by province
Pass (50%+) or oral (40-49%), as a share of scripts written. Dashed lines show the national rate for Paper 1 (navy) and Notary (gold).

Where the marks fell
Share of scripts in each 10-point band, all provinces combined. The shaded area is the oral and pass zone.
Conveyancing results by province
Per paper: pass = 50%+, oral = 40-49%, fail = below 40%. “Cleared” = passed every paper written at this sitting. “Oral” (outcome) = no paper failed but at least one oral pending.
| Province | Cand. | P1 Sat | P1 Pass | P1 Oral | P1 Mean | P2 Sat | P2 Pass | P2 Oral | P2 Mean | Cleared | Oral | Failed |
| Gauteng | 438 | 400 | 9 | 20 | 20.2% | 364 | 20 | 34 | 24.1% | 9 | 24 | 395 |
| Western Cape | 191 | 178 | 11 | 21 | 27.5% | 150 | 10 | 28 | 28.9% | 7 | 25 | 155 |
| KwaZulu-Natal | 152 | 133 | 16 | 22 | 31.7% | 130 | 7 | 16 | 25.1% | 4 | 19 | 120 |
| Eastern Cape | 71 | 58 | 4 | 6 | 24.5% | 57 | 1 | 3 | 22.9% | 2 | 1 | 65 |
| Limpopo | 66 | 59 | 3 | 9 | 23.9% | 56 | 2 | 4 | 18.5% | 1 | 5 | 56 |
| Free State | 40 | 37 | 0 | 2 | 19.1% | 31 | 1 | 2 | 23.6% | 0 | 2 | 38 |
| Mpumalanga | 36 | 32 | 0 | 0 | 18.6% | 28 | 2 | 7 | 29.6% | 1 | 3 | 31 |
| North West | 27 | 22 | 2 | 1 | 24.7% | 26 | 3 | 3 | 25.7% | 3 | 1 | 23 |
| Northern Cape | 13 | 12 | 0 | 0 | 19.4% | 12 | 0 | 0 | 23.2% | 0 | 0 | 13 |
| National | 1034 | 931 | 45 | 81 | 23.7% | 854 | 46 | 97 | 24.8% | 27 | 80 | 896 |
Conveyancing pass and 40%+ rates by province
| Province | P1 pass % | P1 40%+ % | P2 pass % | P2 40%+ % | Cleared % | |||||||
| Gauteng | 2.2% | 7.2% | 5.5% | 14.8% | 2.1% | |||||||
| Western Cape | 6.2% | 18.0% | 6.7% | 25.3% | 3.7% | |||||||
| KwaZulu-Natal | 12.0% | 28.6% | 5.4% | 17.7% | 2.6% | |||||||
| Eastern Cape | 6.9% | 17.2% | 1.8% | 7.0% | 2.8% | |||||||
| Limpopo | 5.1% | 20.3% | 3.6% | 10.7% | 1.5% | |||||||
| Free State | 0.0% | 5.4% | 3.2% | 9.7% | 0.0% | |||||||
| Mpumalanga | 0.0% | 0.0% | 7.1% | 32.1% | 2.8% | |||||||
| North West | 9.1% | 13.6% | 11.5% | 23.1% | 11.1% | |||||||
| Northern Cape | 0.0% | 0.0% | 0.0% | 0.0% | 0.0% | |||||||
| National | 4.8% | 13.5% | 5.4% | 16.7% | 2.6% | |||||||
Notary results by province
| Province | Written | Pass | Oral | Fail | Pass % | 40%+ % | Mean | Median | Highest |
| Gauteng | 272 | 25 | 46 | 201 | 9.2% | 26.1% | 30.3% | 29.5% | 65.5% |
| KwaZulu-Natal | 97 | 12 | 20 | 65 | 12.4% | 33.0% | 31.1% | 30.0% | 65.0% |
| Western Cape | 85 | 20 | 19 | 46 | 23.5% | 45.9% | 36.6% | 36.5% | 77.0% |
| Limpopo | 66 | 6 | 13 | 47 | 9.1% | 28.8% | 32.9% | 32.2% | 75.0% |
| Eastern Cape | 42 | 7 | 7 | 28 | 16.7% | 33.3% | 34.0% | 31.8% | 72.0% |
| Mpumalanga | 22 | 3 | 5 | 14 | 13.6% | 36.4% | 31.3% | 31.5% | 57.0% |
| North West | 19 | 0 | 0 | 19 | 0.0% | 0.0% | 21.8% | 21.5% | 35.5% |
| Free State | 17 | 1 | 1 | 15 | 5.9% | 11.8% | 22.3% | 20.5% | 65.0% |
| Northern Cape | 2 | 0 | 0 | 2 | 0.0% | 0.0% | 15.8% | 15.8% | 22.5% |
| National | 622 | 74 | 111 | 437 | 11.9% | 29.7% | 31.3% | 30.5% | 77.0% |


